pyblock tutorial
The estimate of the standard error of a set of data assumes that the data points are completely independent. If this is not true, then naively calculating the standard error of the entire data set can give a substantial underestimate of the true error. This arises in, for example, Monte Carlo simulations where the state at one step depends upon the state at the previous step. Data calculated from the stochastic state hence has serial correlations.
A simple way to remove these correlations is to repeatedly average neighbouring pairs of data points and calculate the standard error on the new data set. As no data is discarded in this process (assuming the data set contains \(2^n\) values), the error estimate should remain approximately constant if the data is truly independent.
pyblock is a python module for performing this reblocking analysis.
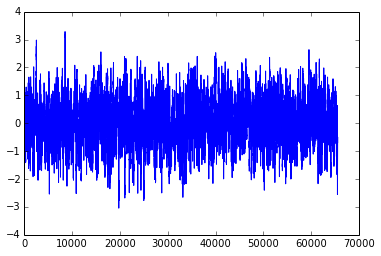
Normally correlated data comes from an experiment or simulation but we’ll use randomly generated data which is serially correlated in order to show how pyblock works.
import numpy
def corr_data(N, L):
    '''Generate random correlated data containing 2^N data points.
    Randon data is convolved over a 2^L/10 length to give the correlated signal.'''
    return numpy.convolve(numpy.random.randn(2**N), numpy.ones(2**L)/10, 'same')
rand_data = corr_data(16, 6)
plot(rand_data);
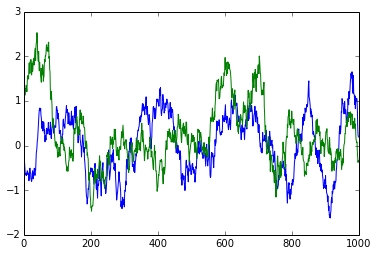
If we zoom in, we can clearly see that neighbouring data points do not immediately appear to be independent:
plot(rand_data[:1000]);
plot(rand_data[40000:41000]);
pyblock can perform a reblocking analysis to get a better estimate of the standard error of the data set:
import pyblock
reblock_data = pyblock.blocking.reblock(rand_data)
for reblock_iter in reblock_data:
    print(reblock_iter)
BlockTuple(block=0, ndata=65536, mean=array(0.029729412388881667), cov=array(0.6337749708548472), std_err=array(0.0031097650382892594), std_err_err=array(8.589659075051008e-06))
BlockTuple(block=1, ndata=32768, mean=array(0.02972941238888195), cov=array(0.628821230364245), std_err=array(0.004380650753518188), std_err_err=array(1.711217811903889e-05))
BlockTuple(block=2, ndata=16384, mean=array(0.02972941238888187), cov=array(0.6213291012014514), std_err=array(0.006158158716248116), std_err_err=array(3.402038032828577e-05))
BlockTuple(block=3, ndata=8192, mean=array(0.0297294123888818), cov=array(0.6072256553888598), std_err=array(0.00860954270047692), std_err_err=array(6.726615807324491e-05))
BlockTuple(block=4, ndata=4096, mean=array(0.02972941238888184), cov=array(0.5804081640995564), std_err=array(0.0119038318174598), std_err_err=array(0.00013153606075677518))
BlockTuple(block=5, ndata=2048, mean=array(0.02972941238888185), cov=array(0.5242933503018304), std_err=array(0.01600008163891877), std_err_err=array(0.0002500623334367383))
BlockTuple(block=6, ndata=1024, mean=array(0.029729412388881837), cov=array(0.4126013837636545), std_err=array(0.02007314222616115), std_err_err=array(0.00044377470816715493))
BlockTuple(block=7, ndata=512, mean=array(0.029729412388881854), cov=array(0.255910704765131), std_err=array(0.02235677962597468), std_err_err=array(0.0006993326391359534))
BlockTuple(block=8, ndata=256, mean=array(0.029729412388881854), cov=array(0.15369260703074866), std_err=array(0.024502280428847067), std_err_err=array(0.0010849792138732355))
BlockTuple(block=9, ndata=128, mean=array(0.029729412388881844), cov=array(0.07649773732547502), std_err=array(0.02444664747680699), std_err_err=array(0.0015339190875488663))
BlockTuple(block=10, ndata=64, mean=array(0.02972941238888185), cov=array(0.0455635621966979), std_err=array(0.026682028770755133), std_err_err=array(0.002377024048671685))
BlockTuple(block=11, ndata=32, mean=array(0.029729412388881847), cov=array(0.025945495376626042), std_err=array(0.028474492629712717), std_err_err=array(0.003616264180239503))
BlockTuple(block=12, ndata=16, mean=array(0.02972941238888184), cov=array(0.012627881930728472), std_err=array(0.02809346224071589), std_err_err=array(0.0051291409958865745))
BlockTuple(block=13, ndata=8, mean=array(0.02972941238888184), cov=array(0.006785523206998811), std_err=array(0.029123708570078285), std_err_err=array(0.00778363852153464))
BlockTuple(block=14, ndata=4, mean=array(0.02972941238888184), cov=array(0.005573075663761713), std_err=array(0.037326517597285024), std_err_err=array(0.015238486998060912))
BlockTuple(block=15, ndata=2, mean=array(0.02972941238888184), cov=array(0.006933024981306826), std_err=array(0.05887709648626886), std_err_err=array(0.04163239418201536))
The standard error of the original data set is clearly around 8 times too small. Note that the standard error of the last few reblock iterations fluctuates substantially—this is simply because of the small number of data points at those iterations.
In addition to the mean and standard error at each iteration, the covariance and an estimate of the error in the standard error are also calculated. Each tuple also contains the number of data points used at the given reblock iteration.
pyblock.blocking can also suggest the reblock iteration at which the standard error has converged (i.e. the iteration at which the serial correlation has been removed and every data point is truly independent).
opt = pyblock.blocking.find_optimal_block(len(rand_data), reblock_data)
print(opt)
print(reblock_data[opt[0]])
[10]
BlockTuple(block=10, ndata=64, mean=array(0.02972941238888185), cov=array(0.0455635621966979), std_err=array(0.026682028770755133), std_err_err=array(0.002377024048671685))
Whilst the above uses just a single data set, pyblock is designed to work on multiple data sets at once (e.g. multiple outputs from the same simulation). In that case, different optimal reblock iterations might be found for each data set. The only assumption is that the original data sets are of the same length.
It is aslo possible to reblock weighted data sets. If the pyblock.blocking routine is supplied with an array of weights in addition to the data, the weighted variance and standard error of each data set are calculated.
pandas integration
The core pyblock functionality is built upon numpy.
However, it is more convenient to use the pandas-based wrapper
around pyblock.blocking, not least because
it makes working with multiple data sets more pleasant.
import pandas as pd
rand_data = pd.Series(rand_data)
rand_data.head()
0   -0.294901
1   -0.360847
2   -0.386010
3   -0.496183
4   -0.625507
dtype: float64
(data_length, reblock_data, covariance) = pyblock.pd_utils.reblock(rand_data)
# number of data points at each reblock iteration
data_length
reblock
0          65536
1          32768
2          16384
3           8192
4           4096
5           2048
6           1024
7            512
8            256
9            128
10            64
11            32
12            16
13             8
14             4
15             2
Name: data length, dtype: int64
# mean, standard error and estimate of the error in the standard error at each
# reblock iteration
# Note the suggested reblock iteration is already indicated.
# pyblock names the data series 'data' if no name is provided in the
pandas.Series/pandas.DataFrame.
reblock_data
| data | ||||
|---|---|---|---|---|
| mean | standard error | standard error error | optimal block | |
| reblock | ||||
| 0 | 0.029729 | 0.003110 | 0.000009 | |
| 1 | 0.029729 | 0.004381 | 0.000017 | |
| 2 | 0.029729 | 0.006158 | 0.000034 | |
| 3 | 0.029729 | 0.008610 | 0.000067 | |
| 4 | 0.029729 | 0.011904 | 0.000132 | |
| 5 | 0.029729 | 0.016000 | 0.000250 | |
| 6 | 0.029729 | 0.020073 | 0.000444 | |
| 7 | 0.029729 | 0.022357 | 0.000699 | |
| 8 | 0.029729 | 0.024502 | 0.001085 | |
| 9 | 0.029729 | 0.024447 | 0.001534 | |
| 10 | 0.029729 | 0.026682 | 0.002377 | <--- |
| 11 | 0.029729 | 0.028474 | 0.003616 | |
| 12 | 0.029729 | 0.028093 | 0.005129 | |
| 13 | 0.029729 | 0.029124 | 0.007784 | |
| 14 | 0.029729 | 0.037327 | 0.015238 | |
| 15 | 0.029729 | 0.058877 | 0.041632 | |
16 rows × 4 columns
# Covariance matrix is not so relevant for a single data set.
covariance
| data | ||
|---|---|---|
| reblock | ||
| 0 | data | 0.633775 |
| 1 | data | 0.628821 |
| 2 | data | 0.621329 |
| 3 | data | 0.607226 |
| 4 | data | 0.580408 |
| 5 | data | 0.524293 |
| 6 | data | 0.412601 |
| 7 | data | 0.255911 |
| 8 | data | 0.153693 |
| 9 | data | 0.076498 |
| 10 | data | 0.045564 |
| 11 | data | 0.025945 |
| 12 | data | 0.012628 |
| 13 | data | 0.006786 |
| 14 | data | 0.005573 |
| 15 | data | 0.006933 |
16 rows × 1 columns
We can also plot the convergence of the standard error estimate and obtain a summary of the suggested data to quote:
pyblock.plot.plot_reblocking(reblock_data);
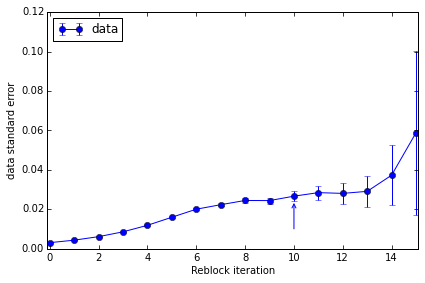
The standard error clearly converges to ~0.022. The suggested reblock iteration (which uses a slightly conservative formula) is indicated by the arrow on the plot.
pyblock.pd_utils.reblock_summary(reblock_data)
| mean | standard error | standard error error | |
|---|---|---|---|
| data | 0.02972941 | 0.02668203 | 0.002377024 |
1 rows × 3 columns
pyblock.error also contains simple error
propogation functions for combining multiple noisy data sets and can
handle multiple data sets at once (contained either within a numpy
array using pyblock.blocking or within a
pandas.DataFrame).